
Relationship between Canopy and Socioeconomic Data
Does tree canopy correlate with socioeconomic trends in Charlotte? The relationship of various census data and tree canopy can be charted together in a graph to identify any trends (trend lines shown in yellow), as shown below.
Is there a relationship between tree canopy cover and population density in Charlotte?
|
The trend line shown in the graph at right (Figure 1) shows that as population density increases, tree canopy decreases. This is not an uncommon trend, as urban areas often have less tree canopy.
|
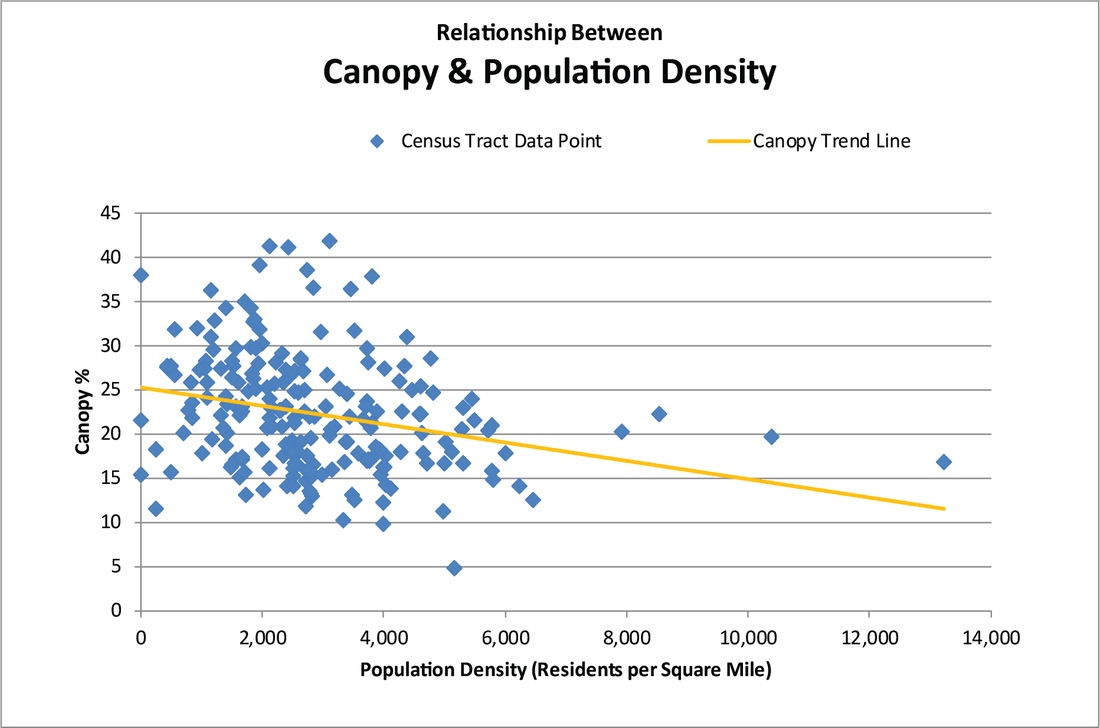
Figure 1. The relationship between the three canopy cover and population density. (Click to enlarge)
|
Does household income relate to canopy cover?
|
The trend line shown in the graph at right (Figure 2) shows that income does not have a discernible impact on canopy cover in Charlotte. This is unique. It is more common in cities that lower income urban areas to also have lower canopy cover. While this is an advantage for Charlotte because it means many residents of varying income levels have access to the benefits trees provide, it also presents a challenge, as more trees mean more resources required for care.
|
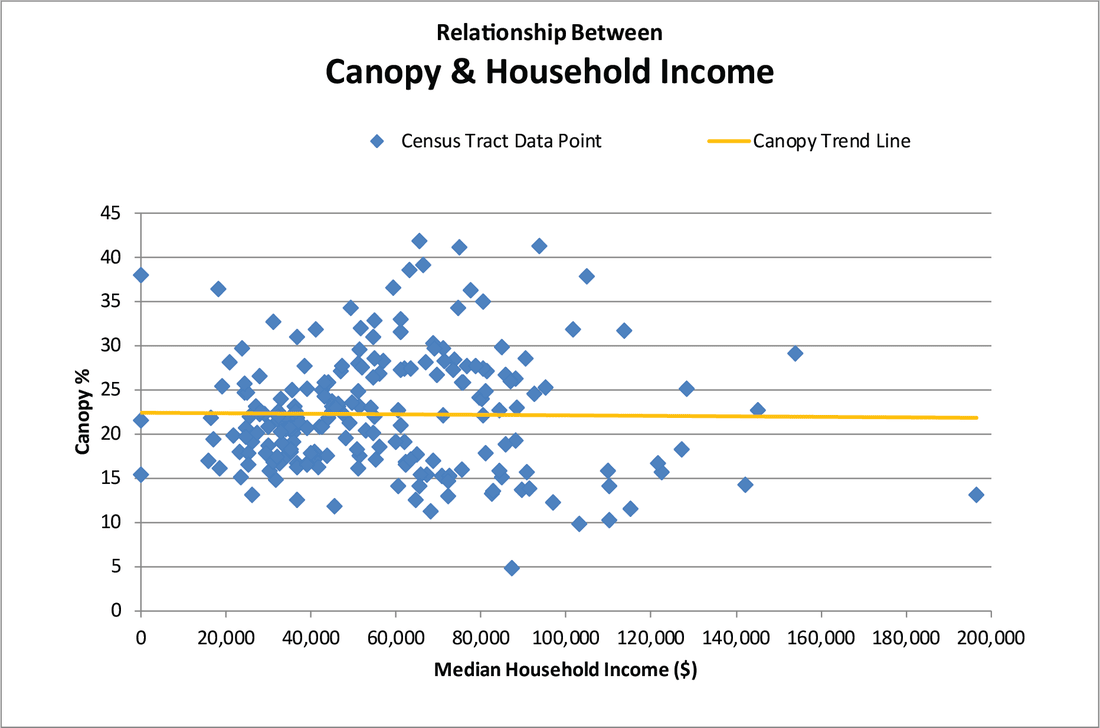
Figure 2. The relationship tree canopy cover and median household income by census tract. (Click to enlarge)
|
How does canopy relate to location of renter or owner occupied homes?
The next two graphs (Figures 3 & 4) depicts this relationship. As is common in many cities, the higher the percentage of owner-occupied homes, the higher the canopy. The reverse is also true - the higher the percentage of renter-occupied homes, the lower the canopy cover tends to be. Home occupancy can be an important factor that should be considered in the care and maintenance of the urban forest.
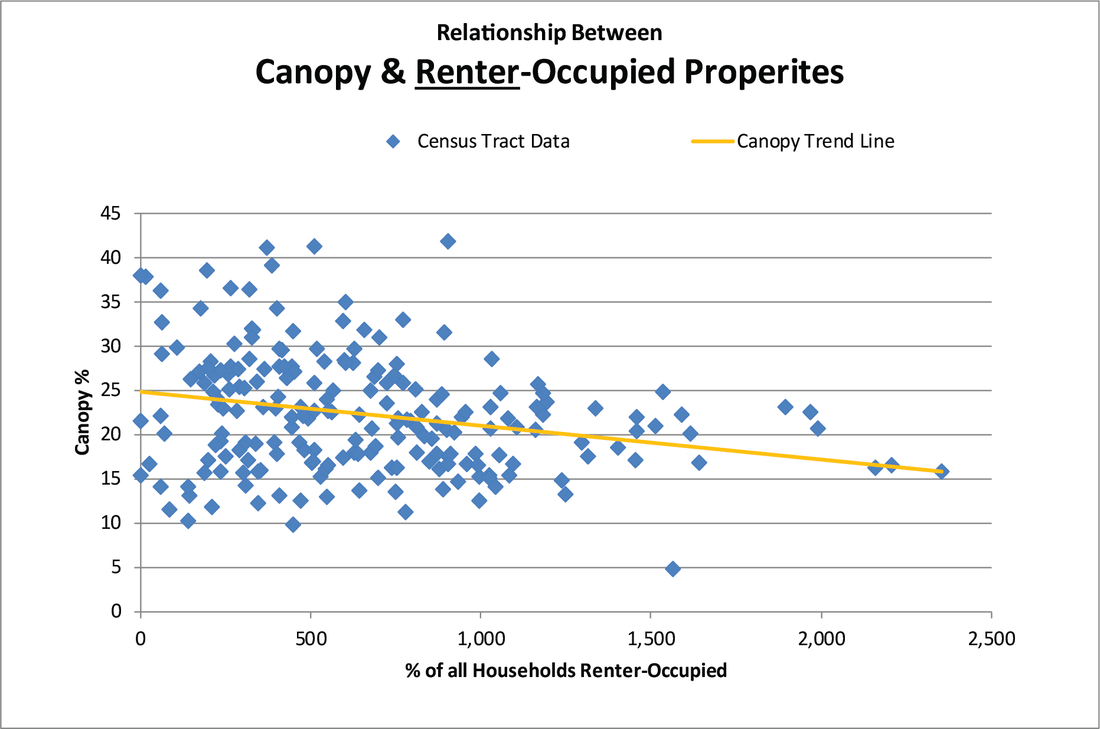
Figure 4. the relationship between tree canopy cover and renter-occupied properties. (Click to enlarge)
|

Figure 3. The relationship between tree canopy cover and owner-occupied properties. (Click to enlarge)
|
Does education level correlate to canopy in Charlotte?
The next set of graphs (Figures 5 & 6) show the relationship between educational level of residents to the percentage of tree canopy cover. Education levels were grouped into two categories - those than have achieved a high school diploma or less, and those with any level of college education.
The trend lines in these two charts show that the areas in Charlotte with higher concentrations for college educated residents have slightly higher canopy than those with a high school diploma or less.
The trend lines in these two charts show that the areas in Charlotte with higher concentrations for college educated residents have slightly higher canopy than those with a high school diploma or less.
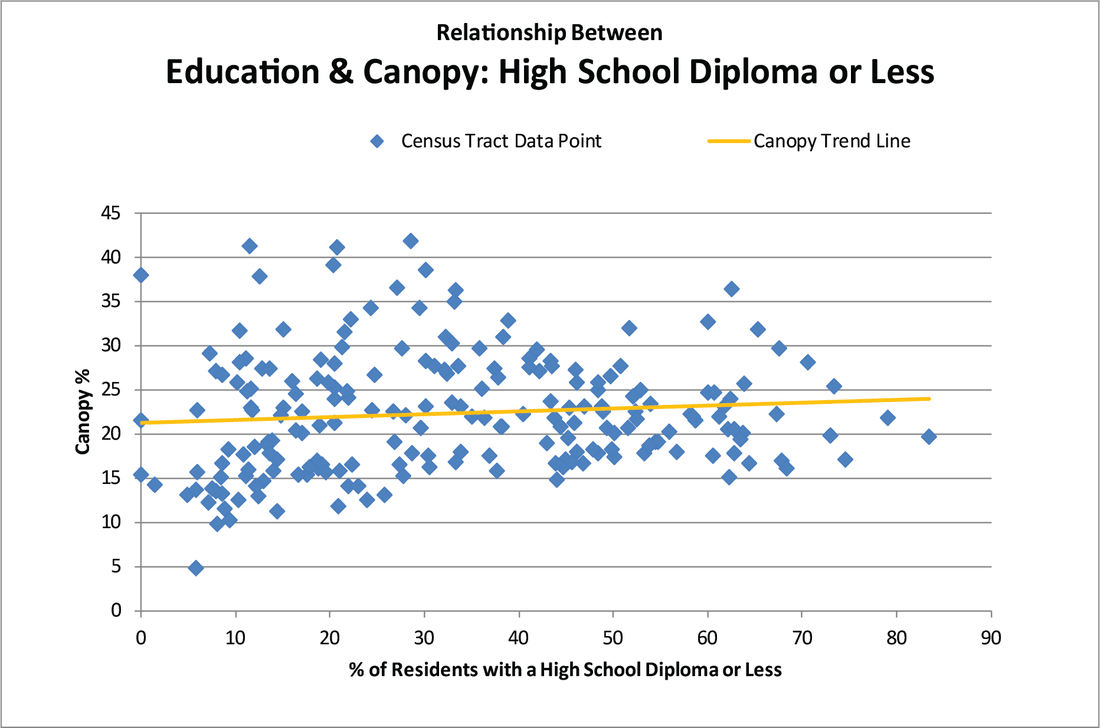
Figure 5. The relationship between the percentage of residents with a high school diploma or less and tree canopy cover. (Click to enlarge)
|
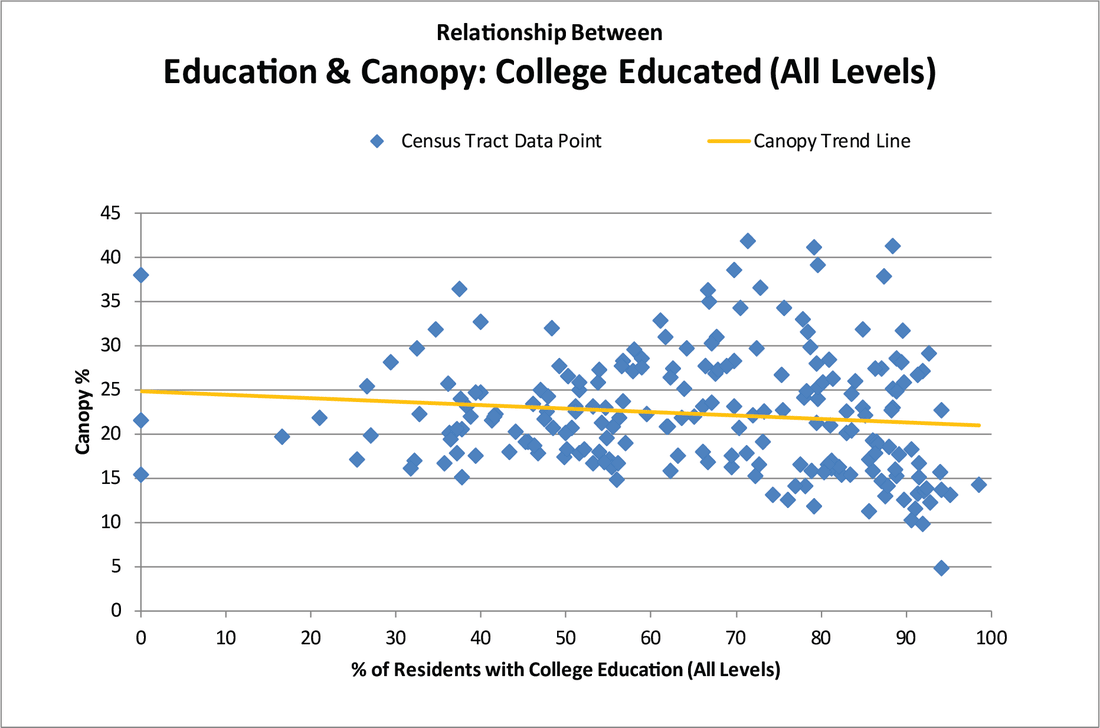
Figure 6. The relationship between the percentage of tree canopy cover and the percentage of residents with a college education. (Click to enlarge)
|
What is the relationship between tree canopy cover residents ages in Charlotte?
|
For ease of consumption, the trend lines of each of the five age groups was graphed together in Figure 7 at right. The middle three groups (ages 18-64) have similar trends in canopy cover, except for the youngest (under 18) and oldest (over 64) groups. Tree canopy cover is higher in areas with more children, and lower in areas with more elderly. The elderly are more susceptible to heat stress, which is significantly higher in areas with lower canopy, so this is an issue that may require further attention in coming years.
|
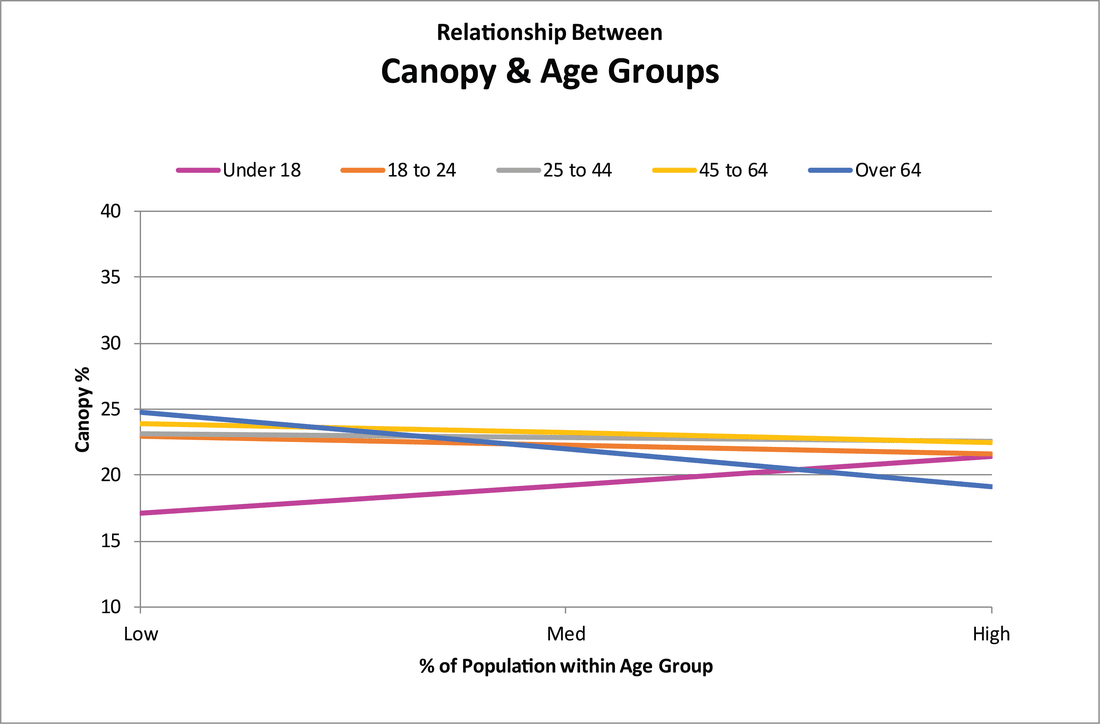
Figure 7. The relationship between the percentage tree canopy cover and percentage of different population age groups. (Click to enlarge)
|
What is the relationship between tree canopy cover and the age of housing?
|
As above, for ease of consumption, just the trend lines of each of the five house-age groups were graphed in Figure 8 at right. Interestingly, tree canopy cover is higher amongst areas with higher percentages of homes built in recent decades (according to census data). Areas with more homes built before 1940 have lower the canopy cover.
|

Figure 8. The relationship between percentage of tree canopy cover and the percentage (in low, medium, and high) of housing from several groups of decades. (Click to enlarge)
|
What is the relationship between tree canopy cover and the value of homes in Charlotte?
|
Figure 9. presents a comparison between the percentage of housing in specified value ranges with the percent of tree canopy cover. Trend lines show higher canopy in areas with more homes in the lowest value range ($0-$50k). The more higher income homes have slightly less canopy (in terms of overall trends).
|
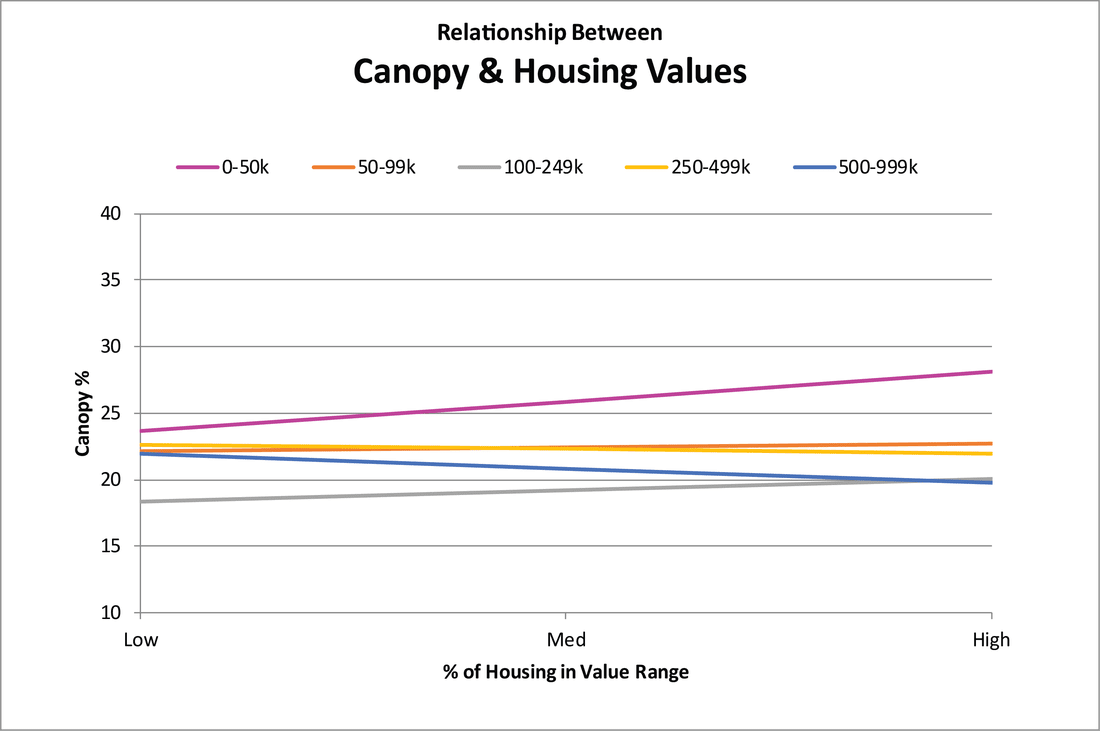
Figure 9. The relationship between tree canopy cover and housing value groups. (Click to enlarge)
|
